Gene Expression Experimental Data Analysis
Goals
Get familiar with exploratory data analysis techniques
- hierarchical clustering (heatmaps and line plots)
- principal component analysis
Data
- differential expression of E. coli cells in biofilm and in suspension (i.e., clump of cells vs cells floating in solution)
- GSE3905 dataset from HW7 (article)
Preprocessing
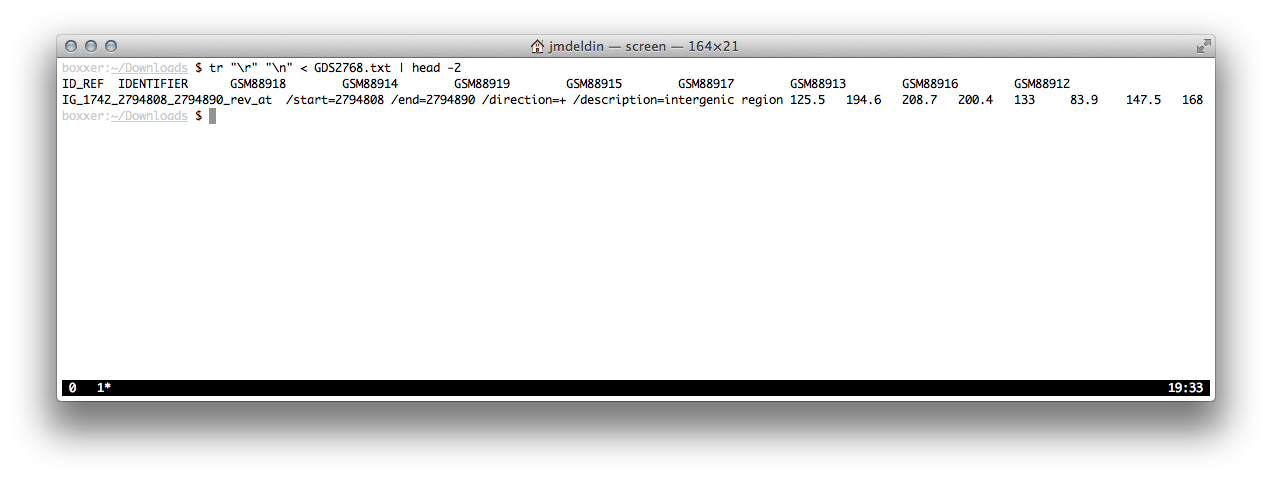
A preview
There are quite a few tab-delimited fields:
Fields
| Time slot | Biofilm | Suspension |
|---|---|---|
| 4 h | GSM88912 | GSM88916 |
| 7 h | GSM88913 | GSM88917 |
| 15 h | GSM88914 | GSM88918 |
| 24 h | GSM88915 | GSM88919 |
Format
| Field | Description |
|---|---|
| 0 | IDREF |
| 1 | IDENTIFIER |
| 2 | 15h-suspension |
| 3 | 15h-biofilm |
| 4 | 24h-suspension |
| 5 | 24h-biofilm |
| 6 | 7h-suspension |
| 7 | 7h-biofilm |
| 8 | 4h-suspension |
| 9 | 4h-biofilm |
Tasks
Write a data parser (~30 lines of Perl):
- Read the data into Perl
- Calculate the differences between suspension and biofilm
- Output a CSV file like this:
| IDREF | diff4 | diff7 | diff15 | diff24 |